RiscFree™ SDK
RiscFree™ is Ashling’s Eclipse-CDT based Integrated Development Environment (IDE) and Debugger.
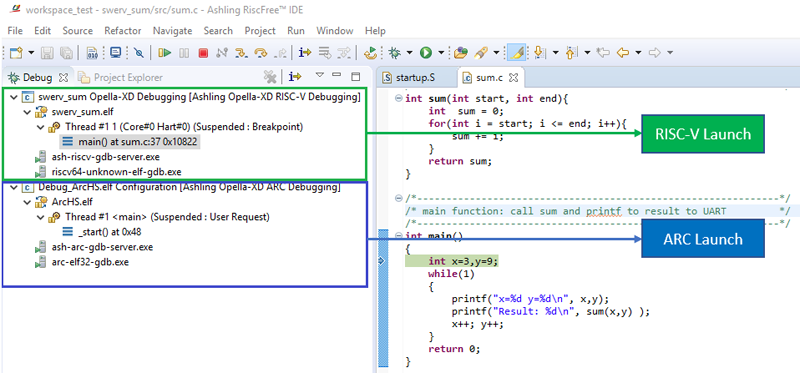 Figure 1. RiscFree™ Debug View with Multi-core RISC-V and ARC launches
RiscFree™ features include:
- IDE based on Eclipse with full source and project creation, editing, build and debug support.
- Integrated GCC and/or LLVM compiler toolchains.
- Project wizards, templates and examples.
- Supports Arm-Cortex, RISC-V, Synopsys ARC-V and ARC and MIPS RISC-V ISA P8700 & I8500 cores.
- Single-shot installer that installs and automatically configures all the component tools to work “out-of-the-box”.
- Automatic source-code formatting, syntax colouring and function folding.
- Works with Windows and Linux Hosts.
- Ashling Hardware Debug and Trace Probe support is fully integrated into the Debugger allowing hardware-based debug and easy setup, capture and display of Trace and Profiling data.
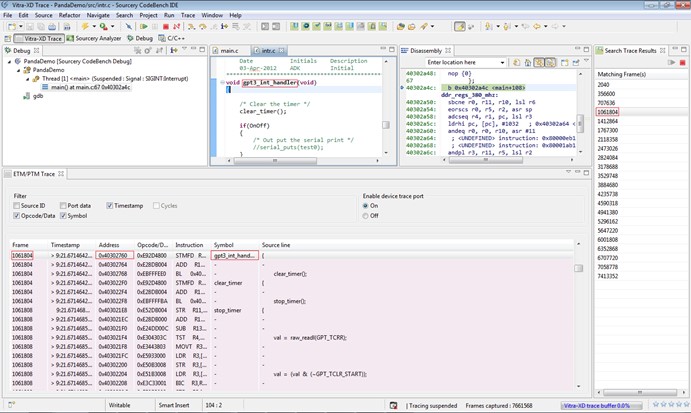 Figure 2. RiscFree™ Trace Display (showing Filter options)
- Integrated Profiling support:
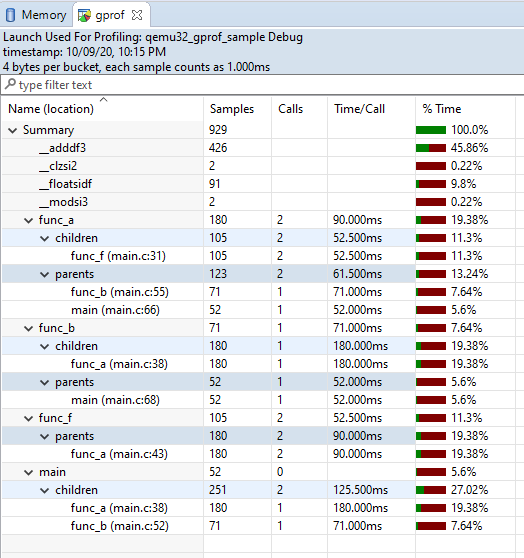
Figure 3. Profiling View in RiscFree™
- Integrated Code Coverage support:
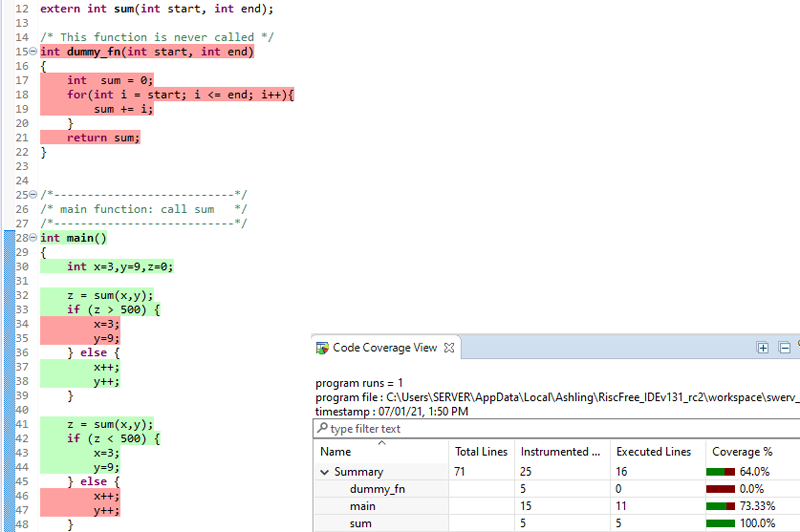
Figure 4. RiscFree™ Code Coverage information in Source Editor and Code Coverage View
- Hardware and software breakpoints and watchpoints.
- ROM or RAM based debugging support (e.g. hardware breakpoints for flash-based support).
- Fast in-target Flash programming.
- QEMU ISA simulator debug support including support for debugging of custom instructions (see Ashling white paper on adding and debugging custom RISC-V instructions to QEMU here). QEMU is installed and integrated into RiscFree™ ready-to-run.
- High-level Register Viewer (e.g. based on SoC CMSIS-SVD or IP-XACT databases).
- Integrated RTOS (e.g. Zephyr, FreeRTOS and others) and OS (e.g. Linux) Debug support.
- Heterogeneous and homogeneous debug support for multi-core SoCs sharing a single hardware (e.g. JTAG/cJTAG/Coresight SWD) debug interface. See here for more details on multi-core support
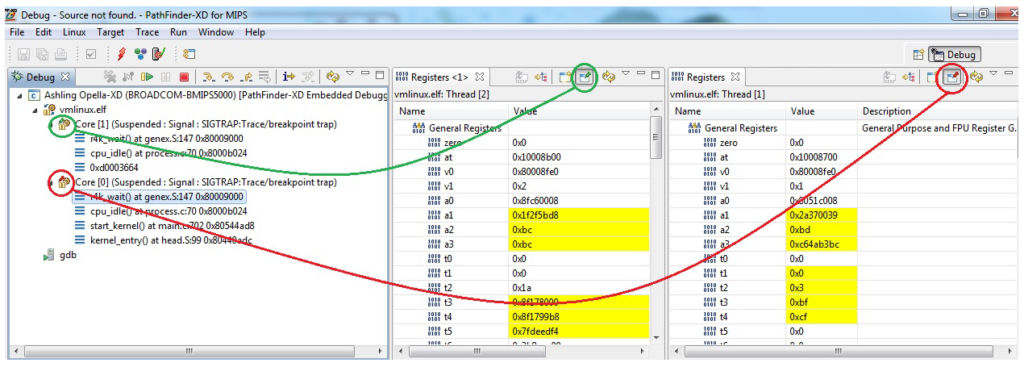
Figure 5. RiscFree™ showing a dedicated, core-specific Register window for each SoC core.
- Debug architectures currently supported include Arm, MIPS, RISC-V and Synopsys ARC all with support for custom instructions.
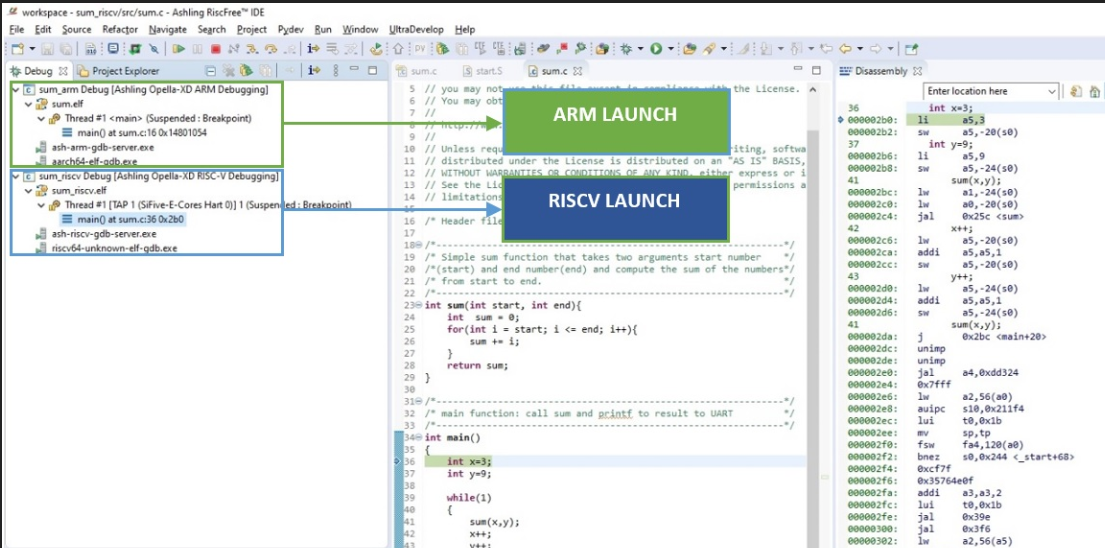
Figure 6. RiscFree™ Multicore Heterogeneous (Arm and RISC-V) Debugging
- Creation of customisable RiscFree™ user-interface “Views” (Windows) using Python scripts.
- Fully scriptable debug interface using Python or GDB syntax.
- Support for SoC wide breakpoints i.e., a single breakpoint can halt all cores in active debug launches.
- Core dump debugging allows post-crash debugging and analysis using a core dump file.
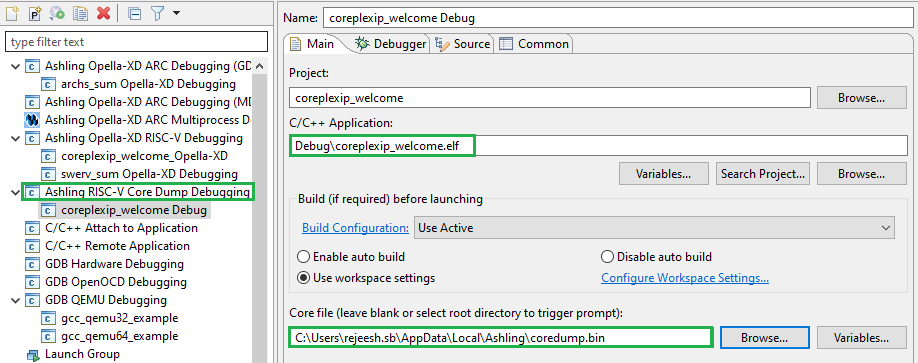
Figure 7. RiscFree™ Core Dump Launch
- RiscFree™ supports core-specific software breakpoints in shared code i.e., only halt if a specified core is running for common code shared between multiple cores.
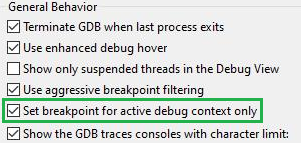 Figure 8. Core-specific Breakpoint Preference Setting in RiscFree™
- RiscFree™ has a dedicated Global Variables view to browse and show global variables in the application (ELF).
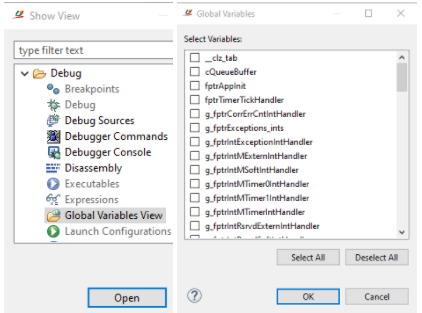 Figure 9. RiscFree™ Global Variables View
